
The reviewer moved the grade more than the model did
396 blinded peer reviews from a fleet of coding agents. Peer grades rank models similarly to public benchmarks—until you look at which model did the grading.
Warmstart grades every task it runs. When a task completes, a different agent inspects the diff and scores it against a fixed rubric. That quality score is recorded alongside the task’s cost and execution time. After two weeks of running a fleet across Claude Code, Codex, Antigravity, and Muse Code on real tasks, we have enough data to ask two questions:
- Do these peer reviews reflect what public benchmarks measure?
- How much does a grade depend on the model that did the work, versus the model that graded it?
The short answers: yes, they align surprisingly well with benchmarks—but who does the grading matters much more than you might expect.
How a task gets graded
Every completed task is assigned to a reviewer from a different agent harness than the author—for example, a Claude Code task is never reviewed by Claude Code. The reviewer receives the task prompt and diff with author details stripped out: commit trailers, model IDs, worker names, and vendor-specific directories are removed. Any review where the author was accidentally identified in prose is flagged and excluded from the dataset.
The rubric covers seven dimensions, each scored 0–10 and weighted into a composite score:
| Dimension | Weight |
|---|---|
| Requirement fidelity | 0.20 |
| Correctness | 0.20 |
| Tests | 0.15 |
| Codebase fit | 0.15 |
| Scope discipline | 0.10 |
| Maintainability | 0.10 |
| Self-sufficiency | 0.10 |
If a dimension does not apply (such as tests for a CSS-only change), it is left unscored rather than given a zero, and the remaining weights are rescaled proportionally.
All figures below include only clean reviews: a single author with no leaks in anonymity. That covers 396 of 754 completed reviews across 204 tasks graded between September 4 and 15, 2026, almost all within Warmstart’s own repository.
Peer grades rank models the way a benchmark does
Warmstart initializes each model’s routing score from a public benchmark, then updates it with internal peer grades as tasks complete. Comparing the two is straightforward: for each model with a published benchmark score, we can place both metrics side by side.
| Model | Peer grade (0–10) | Clean reviews | Terminal-Bench 2.1 |
|---|---|---|---|
| GPT-5.6 Sol | 8.64 | 28 | 85.8% |
| Claude Opus 5 | 8.57 | 95 | 84.6% |
| Gemini 3.8 Flash High | 8.56 | 19 | 81.3% |
| GPT-5.6 Terra | 8.01 | 87 | 77.5% |
| Claude Haiku 4.5 | 7.69 | 12 | 41.8%* |
| Claude Sonnet 5 | 7.63 | 22 | 74.5% |
The top four models rank in the exact same order as the benchmark. The only inversion is at the bottom between Sonnet 5 and Haiku 4.5, where Haiku has the smallest sample size (12 reviews). Across all six models, the rank correlation is ρ ≈ 0.94.
However, two differences stand out:
- The score distributions differ significantly. While the benchmark spans from 42% to 86%, peer grades cluster narrowly between 7.6 and 8.6. Haiku’s benchmark score is roughly half of Sonnet’s, yet in peer reviews they score almost the same. One likely reason: reviewers only evaluate the diff in front of them, and the scheduler tends to assign simpler tasks to smaller models.
- Benchmarks do not capture effort settings. Public leaderboards report a single score for Gemini 3.8 Flash (corresponding to high effort). On our fleet, Gemini 3.8 Flash on medium effort averaged 7.53 compared to 8.56 on high—the lowest score in our fleet—at roughly the same cost per task.
* Haiku 4.5’s figure is Anthropic’s own Terminal-Bench number (41.75%, averaged over five runs), not the Terminal-Bench 2.1 leaderboard the others come from. Benchmark scores were retrieved on September 4, 2026.
Who does the grading matters
Grouped by the reviewer rather than the author, the same clean reviews show clear divergence:
| Reviewing agent | Reviewer model | Reviews | Average grade given |
|---|---|---|---|
| Antigravity | Gemini 3.8 Flash Medium | 79 | 8.91 |
| Claude Code | Haiku 4.5 | 134 | 8.19 |
| Muse Code | Muse Spark 1.3 | 89 | 8.05 |
| Codex | GPT-5.6 Luna, GPT-5.4 mini | 94 | 7.57 |
Raw averages can be misleading if one reviewer happened to evaluate better tasks. To isolate reviewer bias, we can compare how different reviewers graded the exact same author model. For instance, Claude Opus 5’s work was graded by three different reviewers:
| Opus 5’s work, graded by | Reviews | Average |
|---|---|---|
| Antigravity | 33 | 9.58 |
| Muse Code | 24 | 8.27 |
| Codex | 38 | 7.89 |
Even with the same author model, the same rubric, and blinded code, the average scores differed by 1.7 points. This pattern recurs across overlapping reviewers: Gemini 3.8 Flash Medium received an average of 8.12 from Claude Code, but only 6.49 from Codex.
To quantify this bias across all models, we compared each reviewer’s grades against the peer consensus for author models reviewed by at least two agents (with at least five reviews each), weighted by review count:
| Reviewing agent | Compared on | Against the consensus |
|---|---|---|
| Antigravity | 67 reviews of 3 models | +0.64 |
| Claude Code | 122 reviews of 5 models | +0.08 |
| Muse Code | 73 reviews of 5 models | −0.02 |
| Codex | 80 reviews of 5 models | −0.61 |
Antigravity’s reviewer averaged about 0.6 points above consensus, while Codex averaged about 0.6 points below. That 1.25-point spread between reviewers is wider than the 1.0-point difference between the best and sixth-best models in our benchmark comparison.
This reflects the specific reviewer models configured on this fleet, not fundamental traits of each vendor. These accounts used lightweight, fast models for reviews; a frontier model from the same provider might grade quite differently. But it highlights a crucial takeaway: a score of 8.6 out of 10 is difficult to interpret without knowing which model assigned it.
How Warmstart handles reviewer bias
This variance is why individual grades are never used directly to make routing decisions. Warmstart initializes each model at its benchmark score and adjusts it toward empirical peer grades gradually, using a Bayesian prior weighted equivalent to eight reviews. A single review shifts a model’s rating by roughly 11%, requiring about twenty reviews before local data outweighs the prior.
This ensures an unusually generous or critical reviewer cannot skew a model’s rating. These findings also support two future adjustments: slowing down prior updates even further, or normalizing each grade by the reviewer’s measured offset before incorporating it.
Cost and speed trade-offs
Quality is only one of three factors Warmstart balances alongside cost and execution time. In the charts below, each point represents a model’s average across all completed tasks (with at least five tasks per axis). Each axis is oriented so that points farther from the origin represent better performance: higher quality, lower cost, and faster turnaround.
Cost is calculated as the share of a flat subscription used by each task, amortized across the account’s billing window, rather than billed API usage. This distinction is important: when an account exceeded its plan into metered overages, tasks were billed at standard API rates. Including overages would raise Opus 5 to $0.46 per task and Sonnet 5 to $0.62, which reflects plan exhaustion rather than typical model efficiency. The charts below exclude these overages.
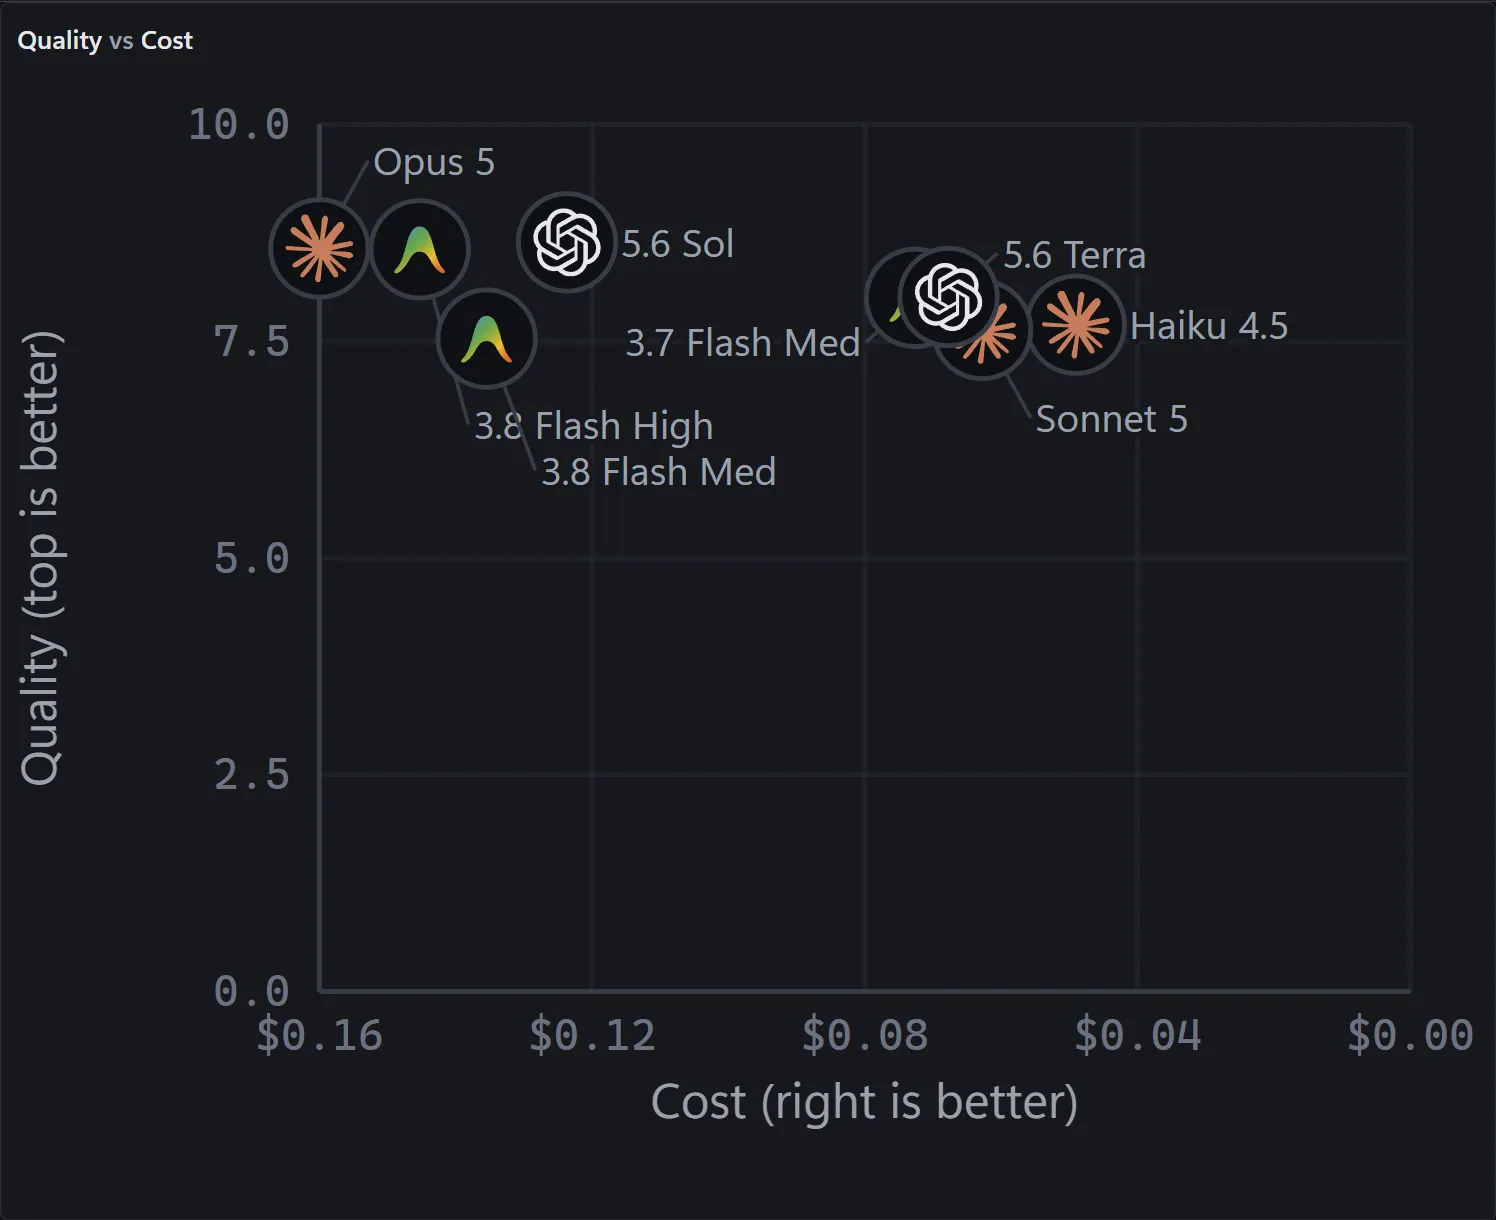
Quality against cost per task. Subscription dollars only, 476 finished tasks, recorded September 16, 2026.
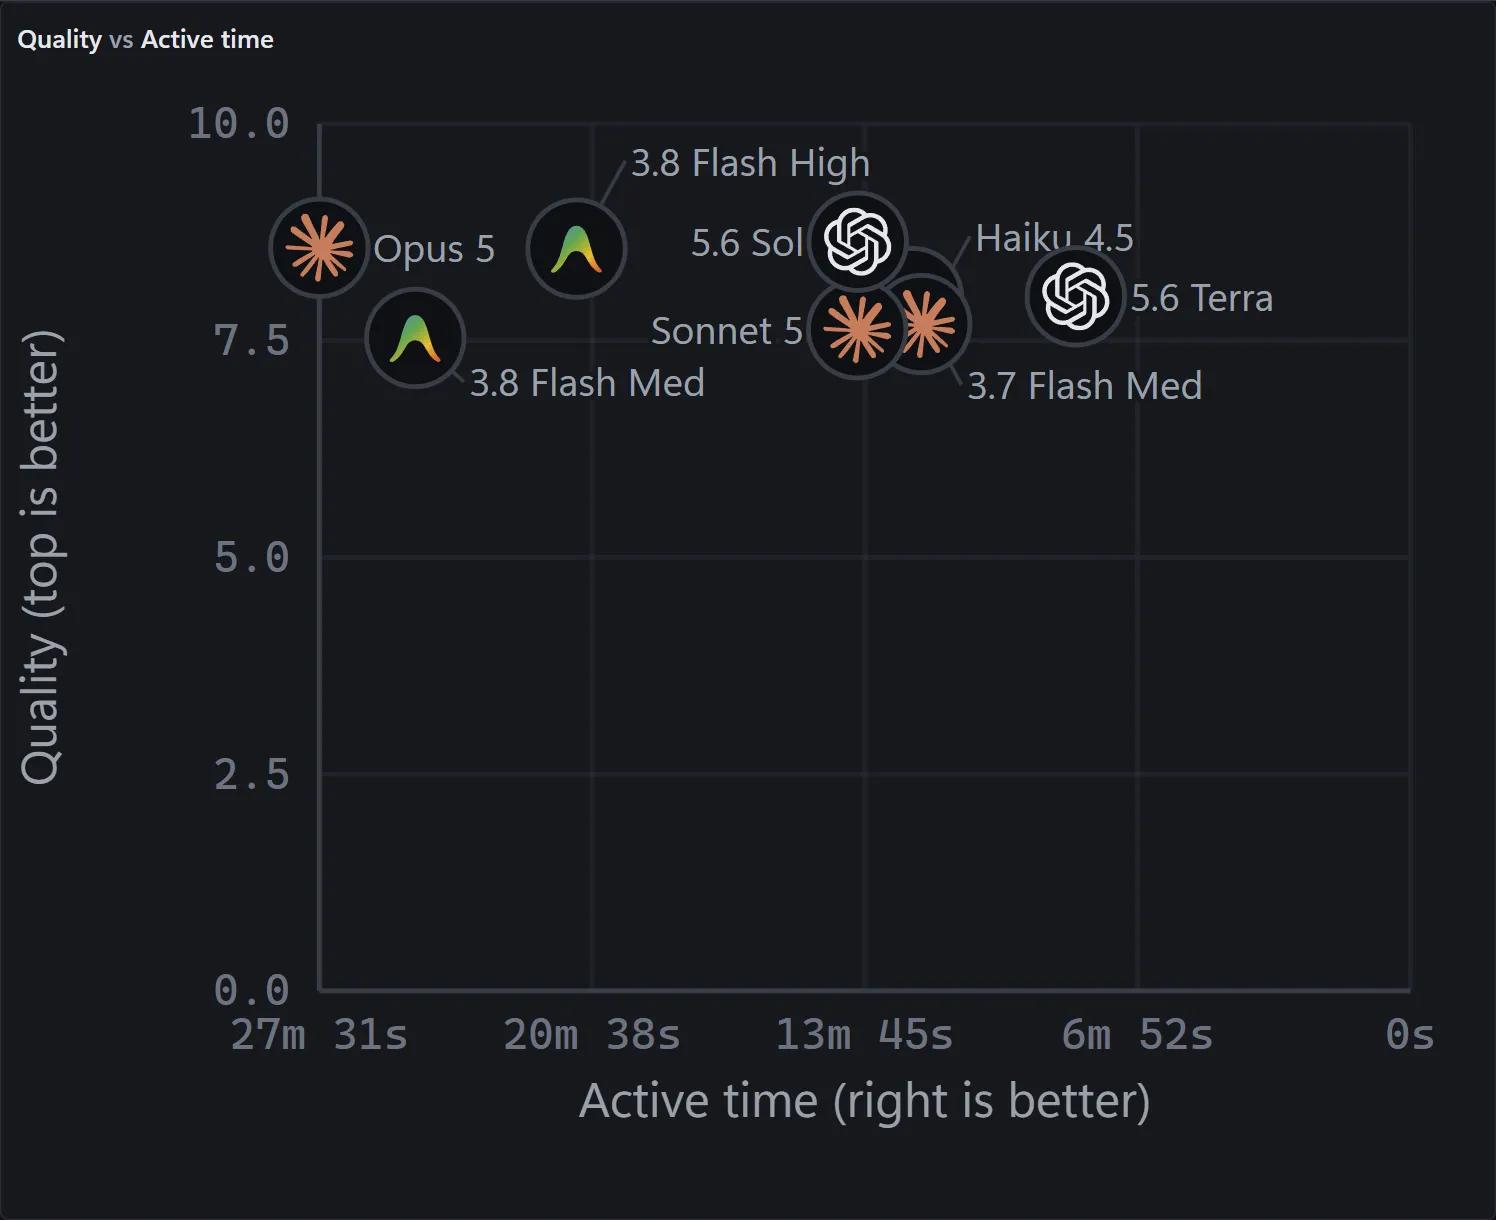
Quality against active time per task: the time an agent was actively running, excluding wall-clock time spent waiting on user input.
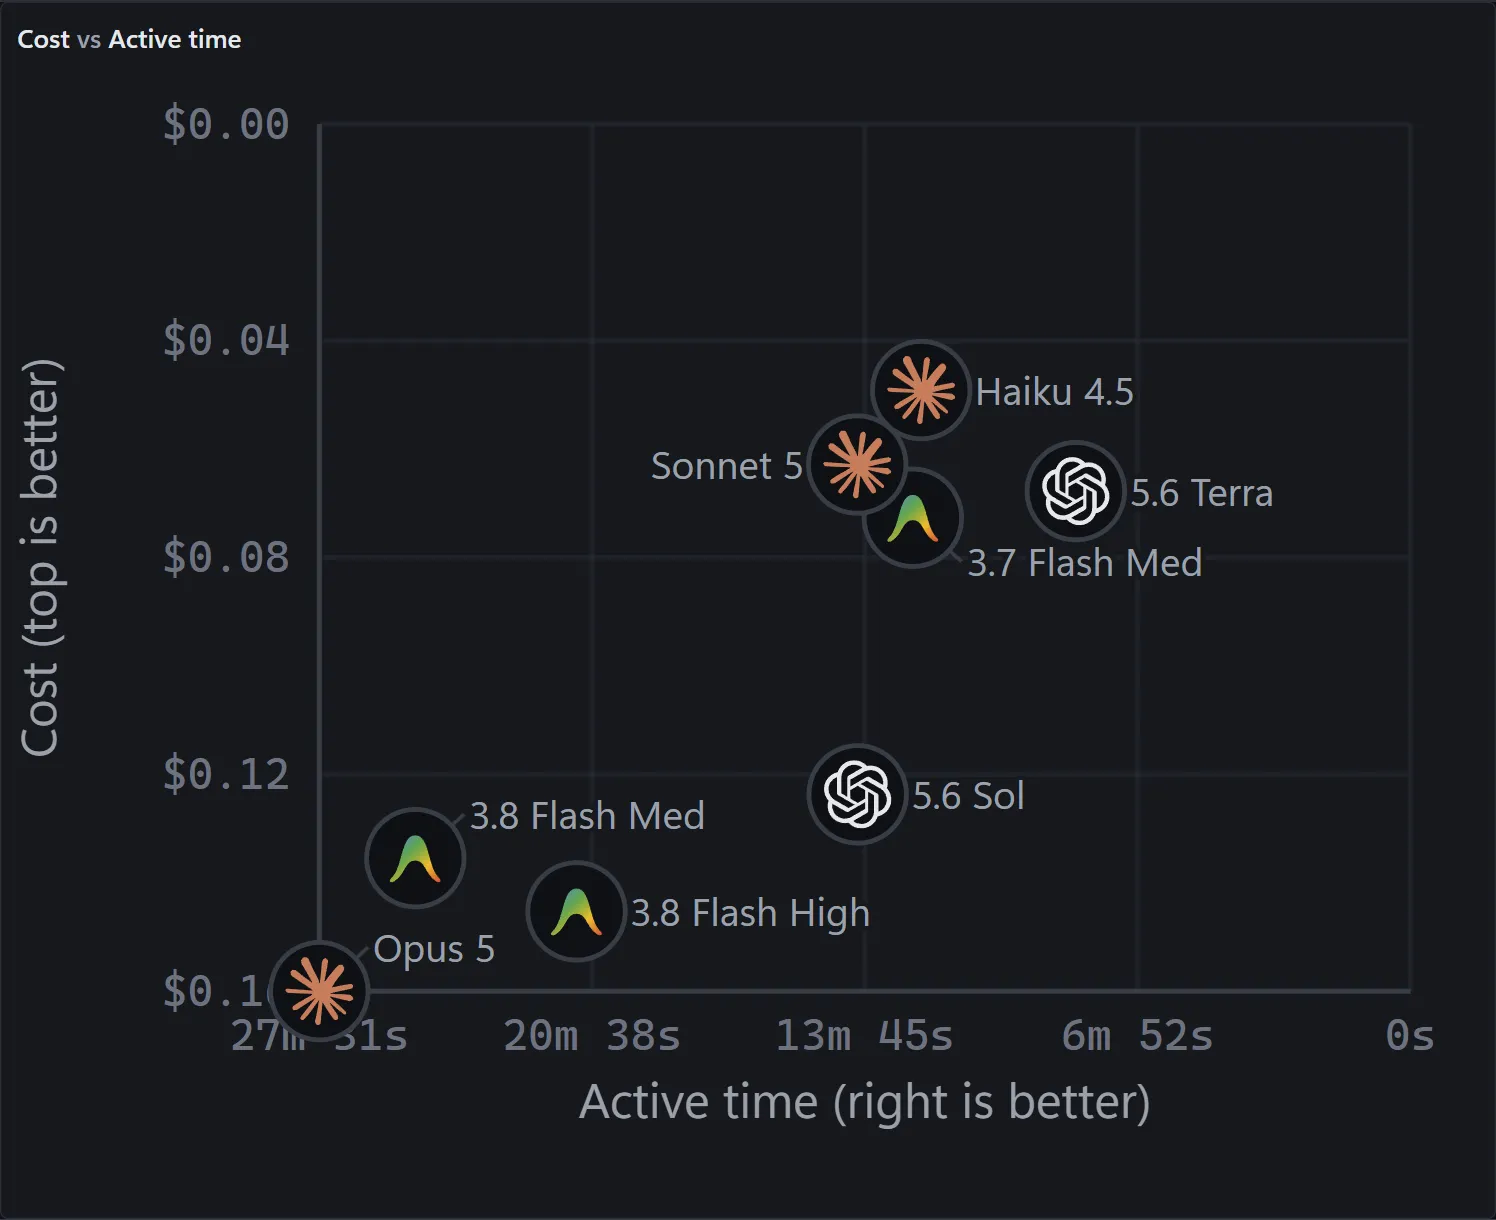
Cost against active time per task.
| Model | Quality | Cost per task | Active time |
|---|---|---|---|
| GPT-5.6 Sol | 8.64 | $0.13 | 13.9 min |
| Claude Opus 5 | 8.57 | $0.16 | 27.5 min |
| Gemini 3.8 Flash High | 8.56 | $0.15 | 21.0 min |
| GPT-5.6 Terra | 8.01 | $0.07 | 8.4 min |
| Gemini 3.7 Flash Medium | 8.00 | $0.07 | 12.6 min |
| Claude Haiku 4.5 | 7.69 | $0.05 | 12.3 min |
| Claude Sonnet 5 | 7.63 | $0.06 | 14.0 min |
| Gemini 3.8 Flash Medium | 7.53 | $0.14 | 25.1 min |
A few observations stand out:
- The top three models score within 0.1 of each other, but vary by 2× in execution time. GPT-5.6 Sol matched Opus 5’s quality in half the active time and at a comparable subscription cost.
- GPT-5.6 Terra offers a strong baseline for speed and cost. It scores about 0.6 points below the top tier in quality, but runs at less than half of Opus 5’s cost and one-third of its time.
- Gemini 3.8 Flash Medium underperformed across all dimensions on this fleet. Compared to High effort, it ran slower, scored a full point lower, and yielded virtually no cost savings.
A key caveat applies to all of these numbers: models were not assigned identical workloads. Warmstart routes more complex tasks to higher-capability models, so longer runtimes and higher costs reflect task difficulty as well as model characteristics.
Limitations and context
- A single fleet workload, operating primarily on one TypeScript repository. These results reflect our specific tasks, not an industry-wide benchmark.
- No task was reviewed multiple times. Comparisons hold the author model constant rather than the specific task, and reviewers were selected based on available quota rather than random assignment.
- Grades represent an LLM’s evaluation against a rubric, uncalibrated across model families. While the alignment with Terminal-Bench is encouraging, it is not formal validation.
- Costs represent amortized subscription fractions, calculated from usage windows rather than itemized invoices.
- These figures evolve continuously. All data was captured on September 16, 2026; subsequent runs will yield updated numbers.
The goal of tracking these numbers is not to declare a universal winner among models. Rather, it is to build an automated scheduler that routes tasks using empirical data—and understands the limits of that data. Currently, peer reviews provide a reliable way to rank models broadly, but evaluating scores across different reviewers still requires careful normalization.
Method. Peer grades and reviewer figures: Warmstart’s quality_reviews table, clean reviews only (single author, no blinding leak), rubric version 1.0, September 4–15, 2026. Reviewer offsets: for each author model graded by at least two reviewing agents with five or more reviews each, the consensus is the unweighted mean of those reviewers’ averages, and each reviewer’s figure is its review-weighted mean difference from it. Cost, active time and the charts: Warmstart’s Analytics › Statistics over all 476 finished tasks, recorded September 16, 2026, rendered by the app’s own chart component. Benchmark scores: the Terminal-Bench 2.1 public leaderboard at vals.ai and Anthropic’s Claude Haiku 4.5 announcement, both retrieved September 4, 2026.